Our goal in this lesson is to explain the macroscopic properties of a gas—such as its pressure and its temperature—in terms of the behavior of the molecules that make it up. However, there is an immediate problem: which gas? Should it be hydrogen, oxygen, or methane, or perhaps uranium hexafluoride? They are all different. Experimenters have found, though, that if we confine 1 mol samples of various gases in boxes of identical volume and hold the gases at the same temperature, then their measured pressures are nearly—though not exactly—the same. If we repeat the measurements at lower gas densities, then these small differences in the measured pressures tend to disappear. Further experiments show that, at low enough densities, all real gases tend to obey the relation

in which p is the absolute (not gauge) pressure, n is the number of moles of gas present, and T is the temperature in kelvins. The symbol R is a constant called the gas constant that has the same value for all gases—namely,

Equation 19-5 is called the ideal gas law. Provided the gas density is low, this law holds for any single gas or for any mixture of different gases. (For a mixture, n is the total number of moles in the mixture.)
We can rewrite Eq. 19-5 in an alternative form, in terms of a constant called the Boltzmann constant k, which is defined as

This allows us to write R = kNA. Then, with Eq. 19-2 (n = N/NA), we see that

Substituting this into Eq. 19-5 gives a second expression for the ideal gas law:

(Caution: Note the difference between the two expressions for the ideal gas law—Eq. 19-5 involves the number of moles n, and Eq. 19-9 involves the number of molecules N.)
You may well ask, “What is an ideal gas, and what is so ‘ideal’ about it?” The answer lies in the simplicity of the law (Eqs. 19-5 and 19-9) that governs its macroscopic properties. Using this law—as you will see—we can deduce many properties of the ideal gas in a simple way. Although there is no such thing in nature as a truly ideal gas, all real gases approach the ideal state at low enough densities—that is, under conditions in which their molecules are far enough apart that they do not interact with one another. Thus, the ideal gas concept allows us to gain useful insights into the limiting behavior of real gases.
With Eq. 19-9, we can explain what crushed the railroad tank car in this lesson’s opening photograph. When the car was being cleaned, its interior was filled with very hot steam, which is a gas of water molecules. The cleaning crew left the steam inside the car when they closed all the valves on the car at the end of their work shift. At that point the pressure of the gas in the car was equal to atmospheric pressure because the valves had been opened to the atmosphere during the cleaning. As the car cooled during the night, the steam cooled and much of it condensed, which means that the number N of gas molecules and the temperature T of the gas both decreased. Thus, the right side of Eq. 19-9 decreased, and because volume V was constant, the gas pressure p on the left side also decreased. At some point during the night, the gas pressure inside the car reached such a low value that the external atmospheric pressure was able to crush the car’s steel walls. The cleaning crew could have prevented this accident by leaving the valves open, so that air could enter the car to keep the internal pressure equal to the external atmospheric pressure.
Work Done by an Ideal Gas at Constant Temperature
Suppose we put an ideal gas in a piston–cylinder arrangement like those in Lesson 18. Suppose also that we allow the gas to expand from an initial volume Vi to a final volume Vf while we keep the temperature T of the gas constant. Such a process, at constant temperature, is called an isothermal expansion (and the reverse is called an isothermal compression).
On a p–V diagram, an isotherm is a curve that connects points that have the same temperature. Thus, it is a graph of pressure versus volume for a gas whose temperature T is held constant. For n moles of an ideal gas, it is a graph of the equation

Figure 19-1 shows three isotherms, each corresponding to a different (constant) value of T. (Note that the values of T for the isotherms increase upward to the right.) Superimposed on the middle isotherm is the path followed by a gas during an isothermal expansion from state i to state f at a constant temperature of 310 K.
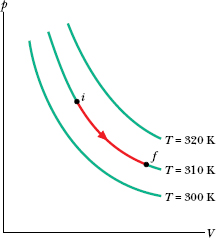
Fig. 19-1 Three isotherms on a p–V diagram. The path shown along the middle isotherm represents an isothermal expansion of a gas from an initial state i to a final state f. The path from f to i along the isotherm would represent the reverse process—that is, an isothermal compression.
To find the work done by an ideal gas during an isothermal expansion, we start with Eq. 18-25,
This is a general expression for the work done during any change in volume of any gas. For an ideal gas, we can use Eq. 19-5 (pV = nRT) to substitute for p, obtaining
Because we are considering an isothermal expansion, T is constant, so we can move it in front of the integral sign to write

By evaluating the expression in brackets at the limits and then using the relationship ln a − ln b = ln (a/b), we find that
Recall that the symbol ln specifies a natural logarithm, which has base e.
For an expansion, Vf is greater than Vi, so the ratio Vf/Vi in Eq. 19-14 is greater than unity. The natural logarithm of a quantity greater than unity is positive, and so the work W done by an ideal gas during an isothermal expansion is positive, as we expect. For a compression, Vf is less than Vi, so the ratio of volumes in Eq. 19-14 is less than unity. The natural logarithm in that equation—hence the work W—is negative, again as we expect.
Work Done at Constant Volume and at Constant Pressure
Equation 19-14 does not give the work W done by an ideal gas during every thermodynamic process. Instead, it gives the work only for a process in which the temperature is held constant. If the temperature varies, then the symbol T in Eq. 19-12 cannot be moved in front of the integral symbol as in Eq. 19-13, and thus we do not end up with Eq. 19-14.
However, we can always go back to Eq. 19-11 to find the work W done by an ideal gas (or any other gas) during any process, such as a constant-volume process and a constant-pressure process. If the volume of the gas is constant, then Eq. 19-11 yields

If, instead, the volume changes while the pressure p of the gas is held constant, then Eq. 19-11 becomes

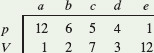
![]() CHECKPOINT 1 An ideal gas has an initial pressure of 3 pressure units and an initial volume of 4 volume units. The table gives the final pressure and volume of the gas (in those same units) in five processes. Which processes start and end on the same isotherm?
CHECKPOINT 1 An ideal gas has an initial pressure of 3 pressure units and an initial volume of 4 volume units. The table gives the final pressure and volume of the gas (in those same units) in five processes. Which processes start and end on the same isotherm?
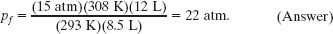
A cylinder contains 12 L of oxygen at 20°C and 15 atm. The temperature is raised to 35°C, and the volume is reduced to 8.5 L. What is the final pressure of the gas in atmospheres? Assume that the gas is ideal.
Solution: The Key Idea here is that, because the gas is ideal, its pressure, volume, temperature, and number of moles are related by the ideal gas law, both in the initial state i and in the final state f (after the changes). Thus, from Eq. 19-5 we can write
piVi = nRTi and pfVf = nRTf.
Dividing the second equation by the first equation and solving for pf yields
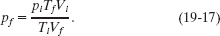
Note here that if we converted the given initial and final volumes from liters to the proper units of cubic meters, the multiplying conversion factors would cancel out of Eq. 19-17. The same would be true for conversion factors that convert the pressures from atmospheres to the proper pascals. However, to convert the given temperatures to kelvins requires the addition of an amount that would not cancel and thus must be included. Hence, we must write
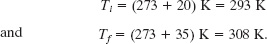
Inserting the given data into Eq. 19-17 then yields
One mole of oxygen (assume it to be an ideal gas) expands at a constant temperature T of 310 K from an initial volume Vi of 12 L to a final volume Vf of 19 L. How much work is done by the gas during the expansion?
Solution: The Key Idea is this: Generally we find the work by integrating the gas pressure with respect to the gas volume, using Eq. 19-11. However, because the gas here is ideal and the expansion is isothermal, that integration leads to Eq. 19-14. Therefore, we can write
The expansion is graphed in the p–V diagram of Fig. 19-2. The work done by the gas during the expansion is represented by the area beneath the curve if.
You can show that if the expansion is now reversed, with the gas undergoing an isothermal compression from 19 L to 12 L, the work done by the gas will be −1180 J. Thus, an external force would have to do 1180 J of work on the gas to compress it.
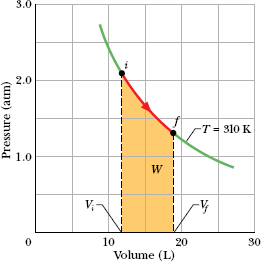
Fig. 19-2 The shaded area represents the work done by 1 mol of oxygen in expanding from Vi to Vf at a constant temperature T of 310 K.
Leave a Reply