You may have noticed that you can increase the speed of the water emerging from a garden hose by partially closing the hose opening with your thumb. Apparently the speed v of the water depends on the cross-sectional area A through which the water flows.
Here we wish to derive an expression that relates v and A for the steady flow of an ideal fluid through a tube with varying cross section, like that in Fig. 14-14. The flow there is toward the right, and the tube segment shown (part of a longer tube) has length L. The fluid has speeds v1 at the left end of the segment and v2 at the right end. The tube has cross-sectional areas A1 at the left end and A2 at the right end. Suppose that in a time interval Δt a volume ΔV of fluid enters the tube segment at its left end (that volume is colored purple in Fig. 14-14). Then, because the fluid is incompressible, an identical volume ΔV must emerge from the right end of the segment (it is colored green in Fig. 14-14).
We can use this common volume ΔV to relate the speeds and areas. To do so, we first consider Fig. 14-15, which shows a side view of a tube of uniform cross-sectional area A. In Fig. 14-15a, a fluid element e is about to pass through the dashed line drawn across the tube width. The element’s speed is v, so during a time interval Δt, the element moves along the tube a distance Δx = v Δt. The volume ΔV of fluid that has passed through the dashed line in that time interval Δt is

Applying Eq. 14-22 to both the left and right ends of the tube segment in Fig. 14-14, we have
ΔV = A1 v1 Δt = A2 v2 Δt
or

This relation between speed and cross-sectional area is called the equation of continuity for the flow of an ideal fluid. It tells us that the flow speed increases when we decrease the cross-sectional area through which the fluid flows (as when we partially close off a garden hose with a thumb).
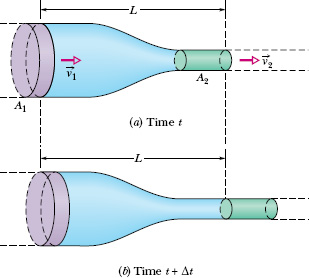
Fig. 14-14 Fluid flows from left to right at a steady rate through a tube segment of length L. The fluid’s speed is v1 at the left side and v2 at the right side. The tube’s cross-sectional area is A1 at the left side and A2 at the right side. From time t in (a) to time t + Δt in (b), the amount of fluid shown in purple enters at the left side and the equal amount of fluid shown in green emerges at the right side.
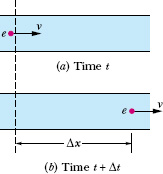
Fig. 14-15 Fluid flows at a constant speed v through a tube. (a) At time t, fluid element e is about to pass the dashed line. (b) At time t + Δt, element e is a distance Δx = v Δt from the dashed line.
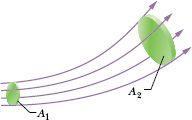
Fig. 14-16 A tube of flow is defined by the streamlines that form the boundary of the tube. The volume flow rate must be the same for all cross sections of the tube of flow.
Equation 14-23 applies not only to an actual tube but also to any so-called tube of flow, or imaginary tube whose boundary consists of streamlines. Such a tube acts like a real tube because no fluid element can cross a streamline; thus, all the fluid within a tube of flow must remain within its boundary. Figure 14-16 shows a tube of flow in which the cross-sectional area increases from area A1 to area A2 along the flow direction. From Eq. 14-23 we know that, with the increase in area, the speed must decrease, as is indicated by the greater spacing between streamlines at the right in Fig. 14-16. Similarly, you can see that in Fig. 14-12 the speed of the flow is greatest just above and just below the cylinder.
We can rewrite Eq. 14-23 as

in which RV is the volume flow rate of the fluid (volume past a given point per unit time). Its SI unit is the cubic meter per second (m3/s). If the density ρ of the fluid is uniform, we can multiply Eq. 14-24 by that density to get the mass flow rate Rm (mass per unit time):

The SI unit of mass flow rate is the kilogram per second (kg/s). Equation 14-25 says that the mass that flows into the tube segment of Fig. 14-14 each second must be equal to the mass that flows out of that segment each second.
![]() CHECKPOINT 3 The figure shows a pipe and gives the volume flow rate (in cm3/s) and the direction of flow for all but one section. What are the volume flow rate and the direction of flow for that section?
CHECKPOINT 3 The figure shows a pipe and gives the volume flow rate (in cm3/s) and the direction of flow for all but one section. What are the volume flow rate and the direction of flow for that section?
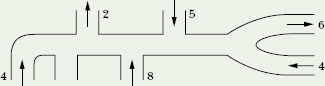
Figure 14-17 shows how the stream of water emerging from a faucet “necks down” as it falls. The indicated cross-sectional areas are A0 = 1.2 cm2 and A = 0.35 cm2. The two levels are separated by a vertical distance h = 45 mm. What is the volume flow rate from the tap?
Solution: The Key Idea here is simply that the volume flow rate through the higher cross section must be the same as that through the lower cross section. Thus, from Eq. 14-24, we have

where v0 and v are the water speeds at the levels corresponding to A0 and A. From Eq. 2-16 we can also write, because the water is falling freely with acceleration g,

Eliminating v between Eqs. 14-26 and 14-27 and solving for v0, we obtain
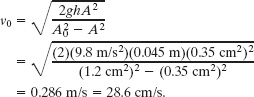
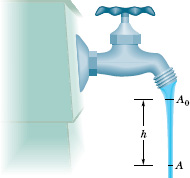
Fig. 14-17 As water falls from a tap, its speed increases. Because the volume flow rate must be the same at all horizontal cross sections of the stream, the stream must “neck down” (narrow).
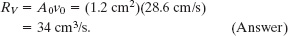
From Eq. 14-24, the volume flow rate RV is then
Leave a Reply