Figure 14-18 represents a tube through which an ideal fluid is flowing at a steady rate. In a time interval Δt, suppose that a volume of fluid ΔV, colored purple in Fig. 14-18, enters the tube at the left (or input) end and an identical volume, colored green in Fig. 14-18, emerges at the right (or output) end. The emerging volume must be the same as the entering volume because the fluid is incompressible, with an assumed constant density ρ.
Let y1, v1, and p1 be the elevation, speed, and pressure of the fluid entering at the left, and y2, v2, and p2 be the corresponding quantities for the fluid emerging at the right. By applying the principle of conservation of energy to the fluid, we shall show that these quantities are related by

We can also write this equation as

Equations 14-28 and 14-29 are equivalent forms of Bernoulli’s equation, after Daniel Bernoulli, who studied fluid flow in the 1700s.* Like the equation of continuity (Eq. 14-24), Bernoulli’s equation is not a new principle but simply the reformulation of a familiar principle in a form more suitable to fluid mechanics. As a check, let us apply Bernoulli’s equation to fluids at rest, by putting v1 = v2 = 0 in Eq. 14-28. The result is
p2 = p1 + ρg(y1 − y2),
which is Eq. 14-7.
A major prediction of Bernoulli’s equation emerges if we take y to be a constant (y = 0, say) so that the fluid does not change elevation as it flows. Equation 14-28 then becomes

which tells us that:
![]() If the speed of a fluid element increases as the element travels along a horizontal streamline, the pressure of the fluid must decrease, and conversely.
If the speed of a fluid element increases as the element travels along a horizontal streamline, the pressure of the fluid must decrease, and conversely.
Put another way, where the streamlines are relatively close together (where the velocity is relatively great), the pressure is relatively low, and conversely.
The link between a change in speed and a change in pressure makes sense if you consider a fluid element. When the element nears a narrow region, the higher pressure behind it accelerates it so that it then has a greater speed in the narrow region. When it nears a wide region, the higher pressure ahead of it decelerates it so that it then has a lesser speed in the wide region.
Bernoulli’s equation is strictly valid only to the extent that the fluid is ideal. If viscous forces are present, thermal energy will be involved. We take no account of this in the derivation that follows.
Proof of Bernoulli’s Equation
Let us take as our system the entire volume of the (ideal) fluid shown in Fig. 14-18. We shall apply the principle of conservation of energy to this system as it moves from its initial state (Fig. 14-18a) to its final state (Fig. 14-18b). The fluid lying between the two vertical planes separated by a distance L in Fig. 14-18 does not change its properties during this process; we need be concerned only with changes that take place at the input and output ends.
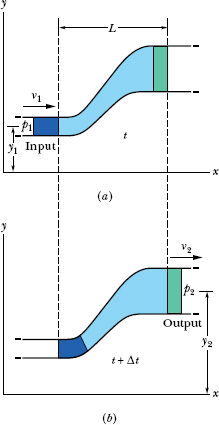
Fig. 14-18 Fluid flows at a steady rate through a length L of a tube, from the input end at the left to the output end at the right. From time t in (a) to time t + Δt in (b), the amount of fluid shown in purple enters the input end and the equal amount shown in green emerges from the output end.
First, we apply energy conservation in the form of the work–kinetic energy theorem,

which tells us that the change in the kinetic energy of our system must equal the net work done on the system. The change in kinetic energy results from the change in speed between the ends of the tube and is
in which Δm (= ρ ΔV) is the mass of the fluid that enters at the input end and leaves at the output end during a small time interval Δt.
The work done on the system arises from two sources. The work Wg done by the gravitational force (Δm ![]() ) on the fluid of mass Δm during the vertical lift of the mass from the input level to the output level is
) on the fluid of mass Δm during the vertical lift of the mass from the input level to the output level is
This work is negative because the upward displacement and the downward gravitational force have opposite directions.
Work must also be done on the system (at the input end) to push the entering fluid into the tube and by the system (at the output end) to push forward the fluid that is located ahead of the emerging fluid. In general, the work done by a force of magnitude F, acting on a fluid sample contained in a tube of area A to move the fluid through a distance Δx, is
F Δx = (pA)(Δx) = p(A Δx) = p ΔV.
The work done on the system is then p1 ΔV, and the work done by the system is −p2 ΔV. Their sum Wp is
The work–kinetic energy theorem of Eq. 14-31 now becomes
W = Wg + Wp = ΔK.
Substituting from Eqs. 14-32, 14-33, and 14-34 yields

This, after a slight rearrangement, matches Eq. 14-28, which we set out to prove.
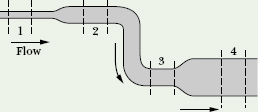
![]() CHECKPOINT 4 Water flows smoothly through the pipe shown in the figure, descending in the process. Rank the four numbered sections of pipe according to (a) the volume flow rate RV through them, (b) the flow speed v through them, and (c) the water pressure p within them, greatest first.
CHECKPOINT 4 Water flows smoothly through the pipe shown in the figure, descending in the process. Rank the four numbered sections of pipe according to (a) the volume flow rate RV through them, (b) the flow speed v through them, and (c) the water pressure p within them, greatest first.
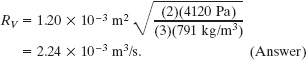
Ethanol of density ρ = 791 kg/m3 flows smoothly through a horizontal pipe that tapers (as in Fig. 14-14) in cross-sectional area from A1 = 1.20 × 10⁻³ m2 to A2 = A1/2. The pressure difference between the wide and narrow sections of pipe is 4120 Pa. What is the volume flow rate RV of the ethanol?
Solution: One Key Idea here is that, because the fluid flowing through the wide section of pipe must entirely pass through the narrow section, the volume flow rate RV must be the same in the two sections. Thus, from Eq. 14-24,

However, with two unknown speeds, we cannot evaluate this equation for RV.
A second Key Idea is that, because the flow is smooth, we can apply Bernoulli’s equation. From Eq. 14-28, we can write

where subscripts 1 and 2 refer to the wide and narrow sections of pipe, respectively, and y is their common elevation. This equation hardly seems to help because it does not contain the desired RV and it contains the unknown speeds v1 and v2.
However, there is a neat way to make it work for us: First, we can use Eq. 14-35 and the fact that A2 = A1/2 to write
Then we can substitute these expressions into Eq. 14-36 to eliminate the unknown speeds and introduce the desired volume flow rate. Doing this and solving for RV yield
We still have a decision to make: We know that the pressure difference between the two sections is 4120 Pa, but does that mean that p1 − p2 is 4120 Pa or −4120 Pa? We could guess the former is true, or otherwise the square root in Eq. 14-38 would give us an imaginary number. Instead of guessing, however, let’s try some reasoning. From Eq. 14-35 we see that speed v2 in the narrow section (small A2) must be greater than speed v1 in the wider section (larger A1). Recall that if the speed of a fluid increases as the fluid travels along a horizontal path (as here), the pressure of the fluid must decrease. Thus, p1 is greater than p2, and p1 − p2 = 4120 Pa. Inserting this and known data into Eq. 14-38 gives
In the old West, a desperado fires a bullet into an open water tank (Fig. 14-19), creating a hole a distance h below the water surface. What is the speed v of the water exiting the tank?
Solution: A Key Idea is that this situation is essentially that of water moving (downward) with speed v0 through a wide pipe (the tank) of cross-sectional area A and then moving (horizontally) with speed v through a narrow pipe (the hole) of cross-sectional area a. Another Key Idea is that, because the water flowing through the wide pipe must entirely pass through the narrow pipe, the volume flow rate RV must be the same in the two “pipes.” Then from Eq. 14-24,
RV = av = Av0
and thus

Because a ![]() A, we see that v0
A, we see that v0 ![]() v.
v.
A third Key Idea is that we can also relate v to v0 (and to h) through Bernoulli’s equation (Eq. 14-28). We take the level of the hole as our reference level for measuring elevations (and thus gravitational potential energy). Noting that the pressure at the top of the tank and at the bullet hole is the atmospheric pressure p0 (because both places are exposed to the atmosphere), we write Eq. 14-28 as

(Here the top of the tank is represented by the left side of the equation and the hole by the right side. The zero on the right indicates that the hole is at our reference level.) Before we solve Eq. 14-39 for v, we can use our result that v0 ![]() v to simplify it: We assume that
v to simplify it: We assume that ![]() , and thus the term
, and thus the term ![]() in Eq. 14-39, is negligible relative to the other terms, and we drop it. Solving the remaining equation for v then yields
in Eq. 14-39, is negligible relative to the other terms, and we drop it. Solving the remaining equation for v then yields
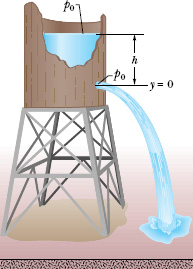
Fig. 14-19 Water pours through a hole in a water tank, at a distance h below the water surface. The pressure at the water surface and at the hole is atmospheric pressure p0.

This is the same speed that an object would have when falling a height h from rest.
As a race car moves forward at 27.25 m/s, air is forced to flow over and under the car (Fig. 14-20a). The air forced to flow under the car enters through a vertical cross-sectional area A0 = 0.0330 m2 at the front of the car (Fig. 14-20b) and then flows beneath the car where the vertical cross-sectional area is A1 = 0.0310 m2. Treat this flow as steady flow through a stationary horizontal pipe that decreases in cross-sectional area from A0 to A1 (Fig. 14-20c).
(a) At the moment it passes through A0, the air is at atmospheric pressure p0. At what pressure p1 is the air as it moves through A1?
Solution: One Key Idea is that, because the flow is steady, we can apply Bernoulli’s equation (Eq. 14-28) to the flow. To be consistent with the given subscripts, we write the equation as

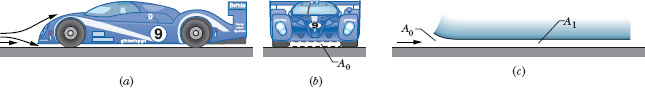
Fig. 14-20 (a) Air flows above and below a race car. (b) The flow beneath the car enters through vertical cross-sectional area A0. (c) The flow is then constrained as in a pipe that narrows to vertical cross-sectional area A1.
where ρ is the air density and y is the distance above the ground of the flowing air.
A second Key Idea is that because all the air entering through cross-sectional area A0 flows through cross-sectional area A1, the volume flow rate RV through the two areas must be the same. Thus, from Eq. 14-24,
A0 v0 = A1 v1,
or
Substituting Eq. 14-41 into Eq. 14-40 and rearranging give us

The speed of the air as it enters A0 at the front of the car is equal to 27.25 m/s, the speed of the car as it moves forward through the air. Substituting this speed, the air density ρ = 1.21 kg/m3, and the values for A0 and A1 into Eq. 14-42, we find
Thus, the air pressure beneath the car is 59.8 Pa less than atmospheric pressure.
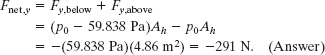
(b) If the horizontal cross-sectional area of the car is Ah = 4.86 m2, what is the magnitude of the net vertical force Fnet,y on the car due to the air pressures above and below the car?
Solution: The Key Idea is that the pressure on a surface is the force per unit area, as given by Eq. 14-4 (p = F/A). Here we are concerned with the top and bottom surfaces of the car, where we take both surfaces to have area Ah. Above the car the air is at atmospheric pressure p0 and presses down on the car with a vertical component
Fy,above = −p0 Ah.
Below the car, the air is at pressure p1 = p0 − 59.838 Pa and presses up on the car with a vertical component
Fy,below = (p0 − 59.838 Pa)Ah.
The net vertical force is then
This net downward force, which is due to the reduced air pressure beneath the car, is the ground effect acting on the car. It is about 30% of the total negative lift that helps hold the car on the track. Without negative lift, a car must greatly slow for turns or else it will slide outward into the track wall. In a race, a driver can reduce the air drag on his car by closely following another car, a procedure known as drafting. However, the leading car disrupts the steady flow of air under the trailing car, eliminating the ground effect on the trailing car. If the trailing driver does not anticipate that elimination and slow accordingly, sliding into the track wall may be unavoidable.
Leave a Reply